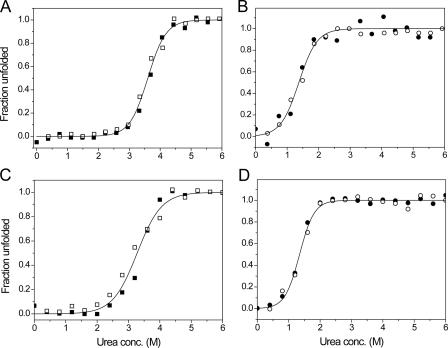
FIGURE 7.
Unfolding profiles of native and EDTA-treated sBdbD. 1 μm pre-reduced and pre-oxidized sBdbD protein was incubated in various concentrations of urea at 25 °C. Fraction unfolded was calculated from the fluorescence intensity. A and B show data from reduced (squares) and oxidized (circles) as-isolated protein, respectively, in 0.1 m Tris-HCl, pH 8.0. The folding (open symbols) and unfolding (filled symbols) data were analyzed using supplemental Equation S3, and the resulting fits are drawn as solid lines. C and D show folding and unfolding data from equivalent experiments performed with Ca2+-depleted sBdbD.

