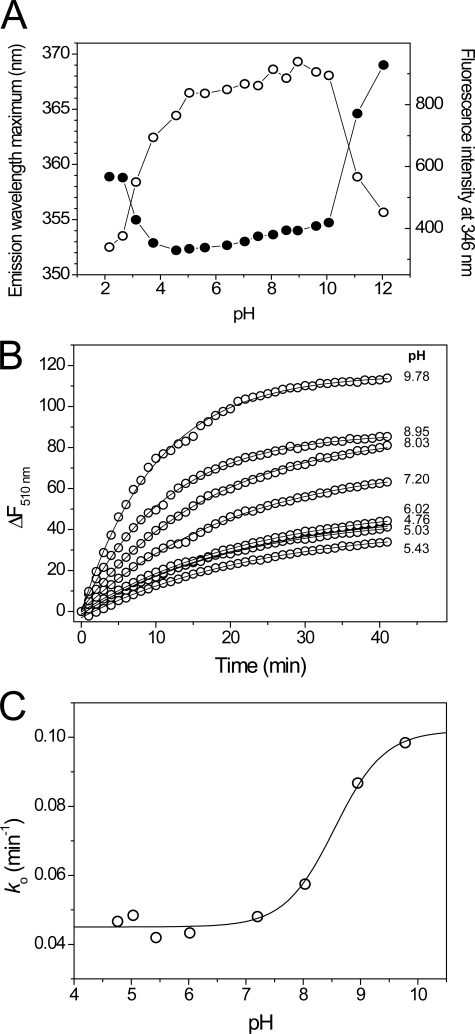
FIGURE 8.
pH stability and pKa determination for BdbD. A, plots of tryptophan fluorescence emission maxima and emission intensity at 346 nm as a function of pH for solutions of sBdbD (0.15 μm in PCTC buffer), as a function of pH. B, time-dependent increases in fluorescence at 510 nm upon reaction with wild-type sBdbD (1 μm) with badan (12 μm) in a mixed buffer system at pH values from 4.76 to 9.78, as indicated, at 25 °C. Plots were fitted (solid lines) to obtain an observed, pseudo-first order rate constant ko. C, plots of ko as a function of pH. The solid line show a fit to supplemental Equation S2.

