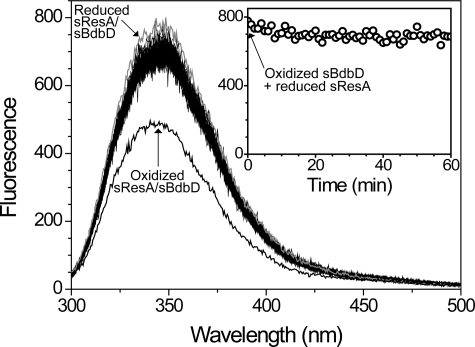
FIGURE 9.
Redox interaction between sBdbD and sResA. Fluorescence spectra of reduced sResA (0.5 μm) at increasing time points following the addition of oxidized sBdbD (0.5 μm) in 0.1 m Tris-HCl, pH 8.0. A plot of fluorescence intensity at 345 nm as a function of time is shown in the inset. Spectra of reduced (in gray) and oxidized sResA/sBdbD (0.5 μm in each) are shown for reference, as indicated.

