FIGURE 1.
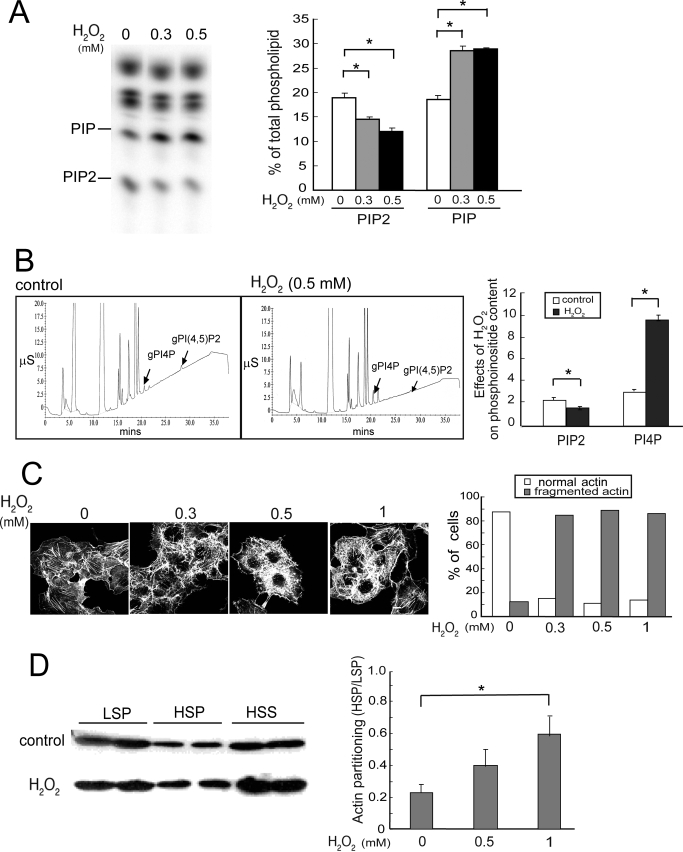
H2O2 disrupts phosphoinositide homeostasis and the actin cytoskeleton. Cells were treated without (Control) or with H2O2 for 20 min unless otherwise indicated. A, TLC. HeLa cells were labeled with [32P]orthophosphate and exposed to H2O2. 32P-Labeled lipids were analyzed by TLC and PhosphorImager analysis. Left, a typical fluorogram of 32P-labeled lipids after separation by TLC; right, quantitation of 32P-labeled lipids (mean ± S.E., n = 3). Amounts of [32P]PIP2 and PIP were expressed as a percentage of the total labeled phospholipids. Asterisks denote statistically significant compared with control, with p < 0.05, in this and all other panels in this figure. B, HPLC. HeLa cells were exposed to 0 or 0.5 mm H2O2 and lipids were extracted. Phospholipids were deacylated and negatively charged glycerol head groups were eluted and detected with suppressed conductivity (μS, microsiemen units). Left, HPLC elution profiles; right, quantitation (mean ± S.E., n = 3). C, actin cytoskeleton. COS cells were fixed and stained with FITC-phalloidin to detect polymerized actin fibers. Data shown are representative of two independent experiments. Left, representative images; right, scoring of actin morphology in cells from 10 randomly chosen fields per condition in a blinded fashion. The percentage of cells with normal long or abnormal actin stress fibers were plotted. 40–50 cells were analyzed per condition. D, partitioning of actin in Triton-soluble and -insoluble fractions. HSS, high speed supernatant. Left, Western blot of a representative experiment. Two samples from each condition are shown, and the amount of high speed supernatant loaded is half as much as that in the LSP and HSP; right, ratios of actin in HSP/LSP fractions. Values are mean ± S.E., n = 3. Error bars indicate S.E.M.

