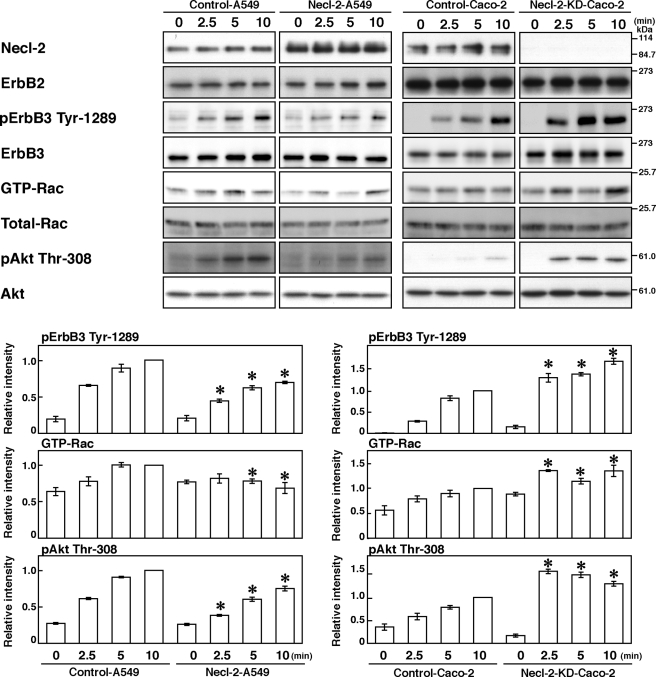
FIGURE 3.
Inhibition by Necl-2 of the HRG-induced, ErbB2-catalyzed tyrosine phosphorylation of ErbB3 and its signaling. A549 cells were transfected with empty vector or FLAG-Necl-2 expression vector (Control A549 and Necl-2-A549 cells, respectively). Caco-2 cells were transfected with negative control stealth RNAi and stealth RNAi against Necl-2 (Control-Caco2 and Necl-2-KD-Caco-2 cells, respectively). Cells were starved of serum for 20 h and stimulated by 10 ng/ml HRG for the indicated periods of time. Samples were subjected to a Rac pulldown assay or Western blotting using the indicated Abs. Bars in the graph represent the relative band intensity of activated ErbB3, Rac, and Akt, normalized for the total amount of ErbB3, Rac, and Akt, respectively, as compared with a value of control cells treated with HRG for 10 min, which is expressed as 1. Error bars indicate the means ± S.E. of three independent experiments. *, p < 0.05 versus control cells.

