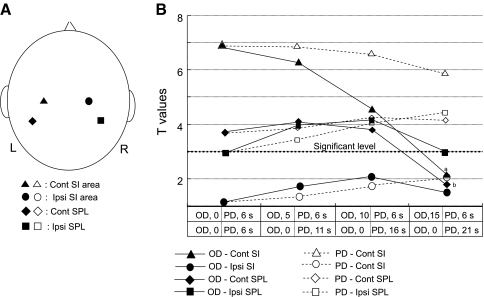
Fig. 14.
Comparison of T values with different onset delays and peak delays in GLM analysis of hemodynamic responses. A Location of NIRS channels analyzed in (B). Cont, contralateral; Ipsi, ipsilateral. B Averaged T values (n = 13) when onset delay (OD, thin solid lines) or peak delay (PD, thin dotted lines) was set at indicated time. Thick dotted line indicates a significant level (T value = 3.0) in GLM analysis. a Significant difference from T values with OD = 0, 5, and 10 (Bonferroni test, P < 0.05); b significant difference from T values with OD = 0, 5, and 10 (Bonferroni test, P < 0.05)

