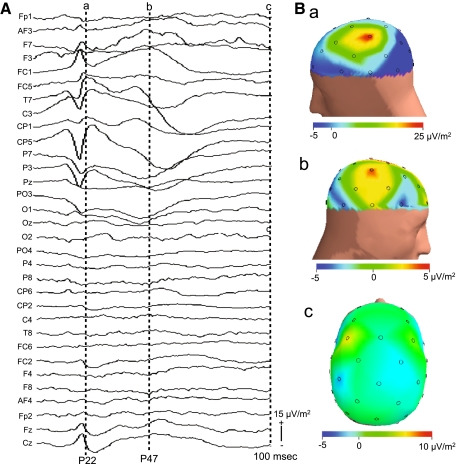
Fig. 4.
Examples of current source density (CSD) waveforms (A) and CSD maps (B). EEG data (SEPs) shown in Fig. 2 were subjected to CSD transformation. Isolatency dotted lines (a), (b), (c) in (A) are at the approximate peaks of P22, P47, and at 100 ms latency, respectively, and latencies of the CSD maps in (B) (a), (b), (c) correspond to those in (A)

