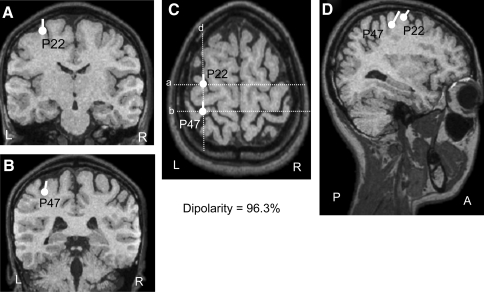
Fig. 5.
Estimated dipoles generating cortical SEPs superimposed on a surface image created by magnetic resonance scans. Location of each dipole base is indicated by a filled circle, and direction of the dipole is indicated by projection of the line. The dipoles estimated at the latencies indicated by P22 and P47 in Fig. 2b were superimposed based on [the] X and Y coordinates of the same subject. The dotted lines (a), (b), (d) in the horizontal plane (C) correspond to the MRI slices in (A), (B), and (D), respectively. The dipolarity was 96.3% in this subject

