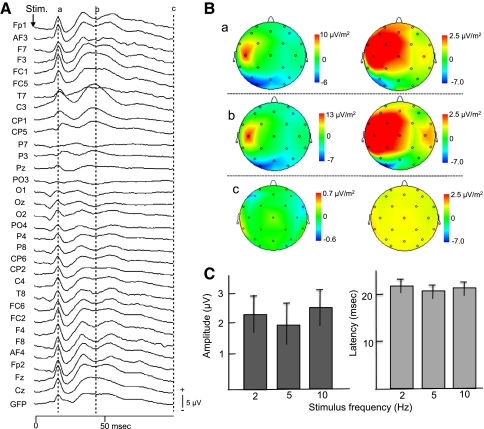
Fig. 6.
Group-averaged SEP data when 10-Hz stimulation was applied. A SEPs recorded from the 32 electrodes. GFP, global field power. Other descriptions as for Fig. 2. B EEG data (SEPs) shown in (A) were subjected to CSD transformation. The data were shown using two different calibrations since the CSD peaks in the ipsilateral parietal cortex were so small that magnified calibration was used. C Comparison of the amplitudes and peak latencies of P22. There were no significant differences in these parameters among the three stimulus frequencies

