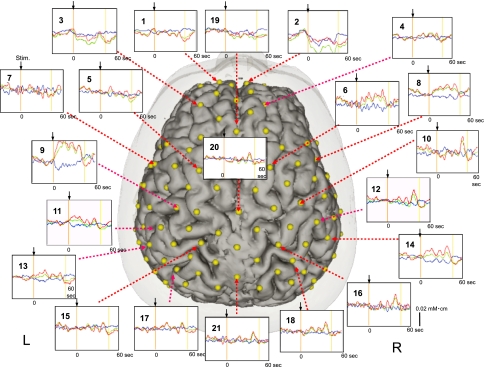
Fig. 8.
Examples of NIRS records in response to 10-Hz electrical stimulation of the right median nerve using the same subject as in Figs. 2, 3, 4, 5. Red, green, and bluelines indicate changes in Oxy-Hb, Total-Hb, and Deoxy-Hb, respectively. Changes in Oxy-Hb rapidly increased at channel 9 around the contralateral SI. Arrows indicate onset of the stimuli

