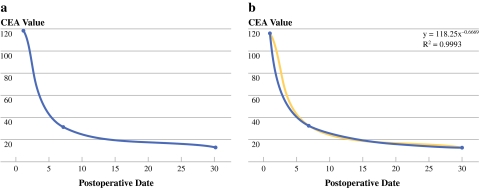
Fig. 1.
CEA values (preoperative, postoperative day 7, postoperative day 30) over time (a). An exponential trend line was drawn using each CEA value. R2 values were calculated as the deviation between calculated curves and the measured CEA value. The function of the exponential curve also was calculated (Y = pX−q). The value “q” represents the gradient; it refers to the acute or slow decrease in CEA following tumor resection (b)

