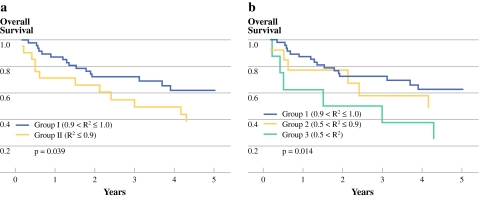
Fig. 3.
The overall survival (OS) curves according to the R2 value in stage III rectal cancer. Group I was the exponential decrease group compared with group II, the nonexponential decrease group. a There was a significant difference between the two groups (P = 0.039). The group also was divided to three subgroups: group 1 was the exponential decrease group; group 2 was the nearly exponential decrease group; and group 3 was the randomized clearance group. b Group 3 had significantly worse OS than group 1 (P = 0.014)

