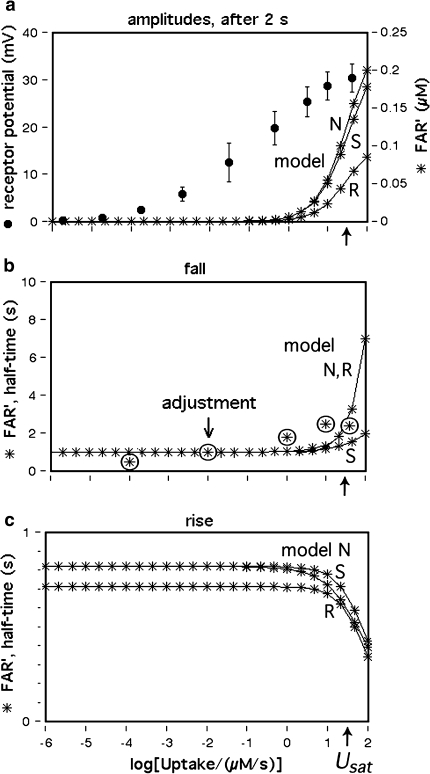
Fig. 1.
Dose–response functions of the recorded receptor potential (mV), and of FAR′ (μM) produced by the chemical models N, R, and S. Abscissa: stimulus uptake U (molecules adsorbed per second and per hair volume, given in μM/s), calibrated using the 3H-labelled major pheromone component (E,Z)-6,11-hexadecadienyl acetate of Antheraea polyphemus (Kaissling 1987, 1995). aDots amplitudes of receptor-potentials extracellularly recorded from single sensilla trichodea of male moths stimulated by the pheromone for 2 s (Zack 1979). The three lowest values were re-measured by Blanka Pophof, Seewiesen. Asterisks concentrations of FAR′, after 2-s stimulation. The theoretical maximum (FAR′max) reached at Usat with infinitely long stimulation amounts to FAR′max = 0.24 μM for models N and S, and FAR′max = 0.11 μM for model R. Usat is the uptake at which the pheromone deactivation is saturated (models N, R) or half-saturated (model S). b Fall of FAR′ after stimulus offset. Encircled asterisks experimental half-times determined from the fall of the receptor potential (from Fig. 4d in Kaissling 1998b). At the “adjustment uptake” of 10−2 μM/s the fall of FAR′ was adjusted to the experimental fall (t1/2FAR′fall = 0.8 s). c Half-times of rise of FAR′ after stimulus onset

