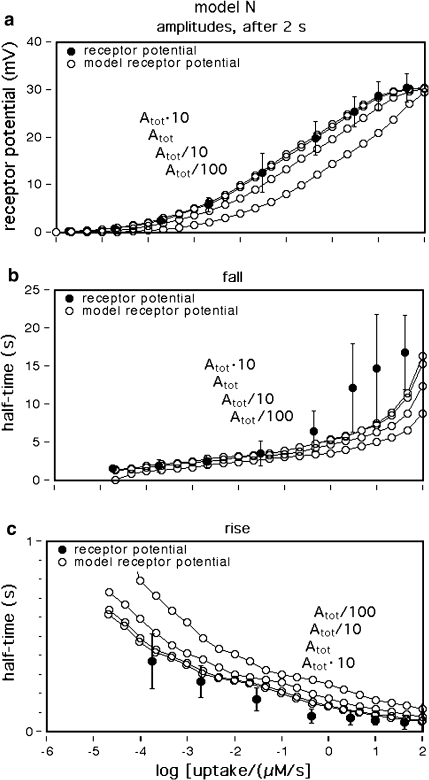
Fig. 10.
Dose–response functions obtained by varying the PBP concentration Atot, model N. Dots experimental data (see legend Fig. 1a). Decreasing PBP concentrations (Atot/10, Atot/100) shift the dose–response curves to higher uptake values. This leads to smaller steady amplitudes (a), faster fall (b), and slower rise of the receptor-potential (c). Interestingly, an increase of the PBP concentration (Atot10) has minimal effects, suggesting that the natural PBP concentration (Atot) is almost optimal

