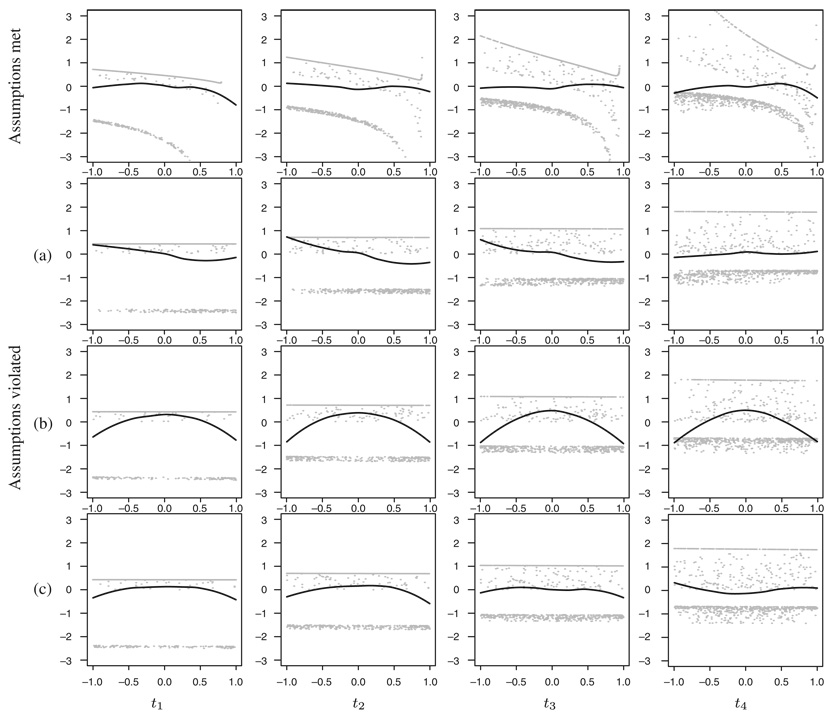
Figure 3.
The smoothed average (black curves) through standardized residuals (grey points) with respect to covariate Z evaluated at four different time points: t1=20th, t2=40th, t3=60th and t4=80th quantile of event times. The four rows of plots represent four different simulated data sets, see text. The data were simulated and fitted using the additive model.

