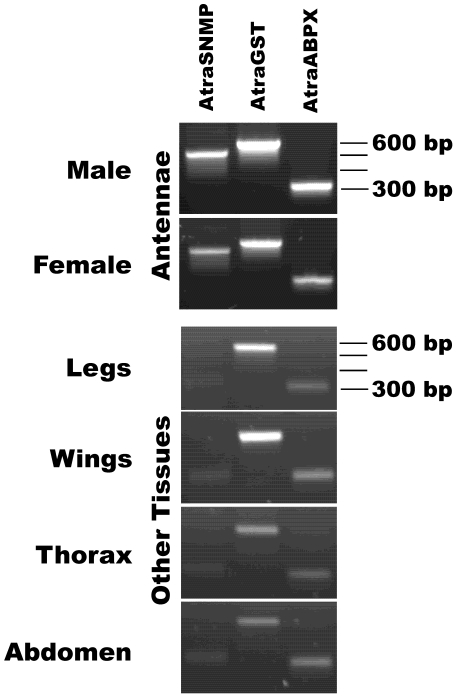
Figure 5. Expression of other olfactory genes in antennal and non-olfactory tissues.
RT-PCR shows that AtraSNMP (expected PCR fragment, 515 bp) is expressed only in male and female antennae, whereas AtraGST (580 bp), and AtraABPX (310 bp) genes are expressed not only in male and female antennae, but also with lower intensity in non-olfactory male tissues: legs, wings, thorax, and abdomen. Analysis of AtraSNMP expression in other tissues showed a non-specific faint band (ca. 350 bp), which does not correspond in size to SNMP band. Migration of the 300, 400, 500, and 600 bp markers are indicated at the right side gels. Template control is shown if Fig. 4.

