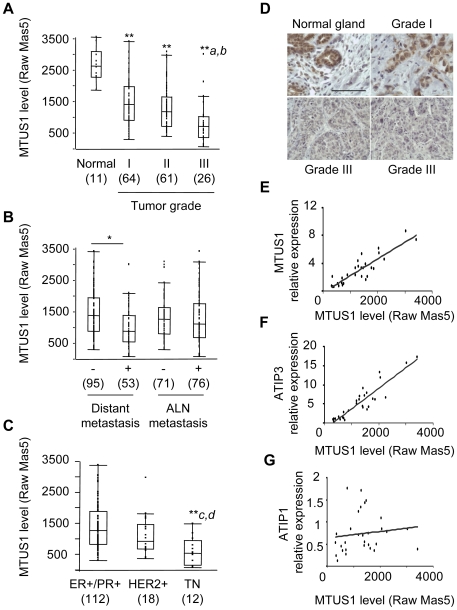
Figure 1. ATIP3 down-regulation in invasive breast carcinomas.
A–B. Comparison of MTUS1 (U133A Affymetrix 212096_s_at) probeset data intensities in (A) normal breast tissue and 151 invasive breast tumors classified according to histological grade (I, II, III), (B) breast tumors classified according to the occurrence of distant metastasis or axillary lymph node (ALN) metastasis and (C) molecular subgroups of breast tumors defined by immunodetection of surrogate markers ER/PR+ (luminal), HER2+ (HER2−like) and ER−, PR−, HER2− (triple negative, TN). Probeset intensities were calculated using Affymetrix Raw MAS5.0 default settings. The number of samples is indicated below in brackets. *p<0.001; **p<0.0001 compared to normal tissue; ap<0.0001 compared to grade I; bp<0.005 compared to grade II; cp<0.0001 compared to ER+/PR+; dp<0.05 compared to HER2+. D. Immunohistochemistry on a breast tumor section of histological grade I and adjacent normal breast tissue (upper panel), and two representative grade III breast cancer sections (lower panel) using anti-MTUS1 monoclonal antibodies. A bar represents 100 µm. E–G. Correlation between MTUS1 (212096_s_at) probeset intensities and real-time RT-PCR expressed relative to internal control EEF1G in 29 representative breast tumor samples. Oligonucleotides were designed to amplify total ATIP transcripts (“MTUS1”) (E), ATIP3 transcripts (F), or ATIP1 transcripts (G).

