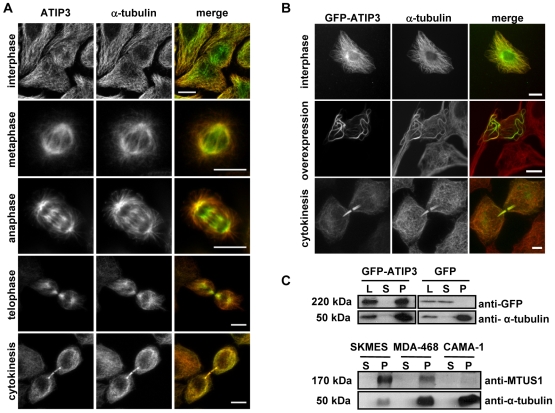
Figure 4. ATIP3 associates with microtubules.
A–B. Representative photomicrographs of confocal microscopy analysis showing the cellular distribution of (A) endogenous ATIP proteins in SK-MES cancer cells and (B) transiently transfected (24 h) GFP-ATIP3 fusion protein, stained with anti-MTUS1 (green) and anti-alpha-tubulin (red) antibodies. A bar represents 10 µm. C. Microtubule co-sedimentation assay performed on MDA-MB-231 stable transfectants expressing GFP-ATIP3 or GFP (upper panel) and SK-MES, MDA-MB-468 and CAMA-1 tumor cells expressing endogenous ATIP3 (lower panel). Immunoblots were revealed using anti-GFP or anti-MTUS1 antibodies, and reprobed with anti-alpha-tubulin antibodies. Molecular weights are indicated on the left. L: total cell lysate; S: supernatant; P: pellet.

