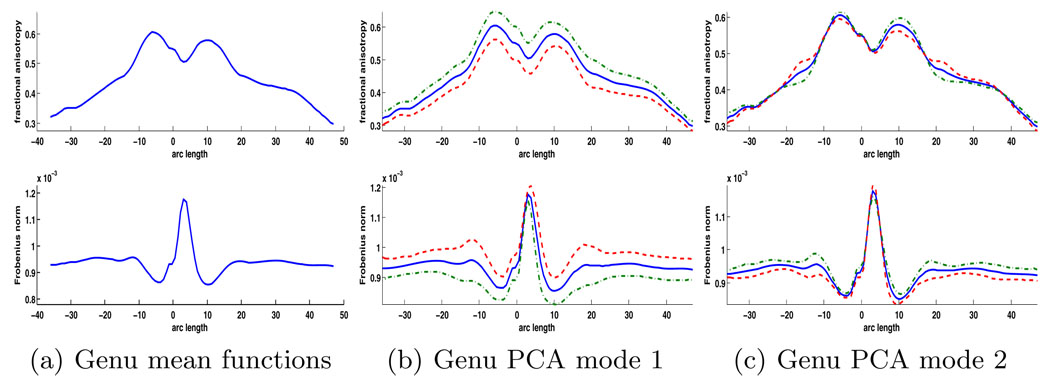
Fig. 3.
Visualization of the PCA modes for the joint analysis of FA and Frobenius norm in the genu tract. The (a) mean functions for the combined population are shown with (b) the first and (c) second PCA modes. The first PCA mode accounts for a large percentage of the variability and shows an overall constant change in FA and an anti-correlated constant change in norm.

