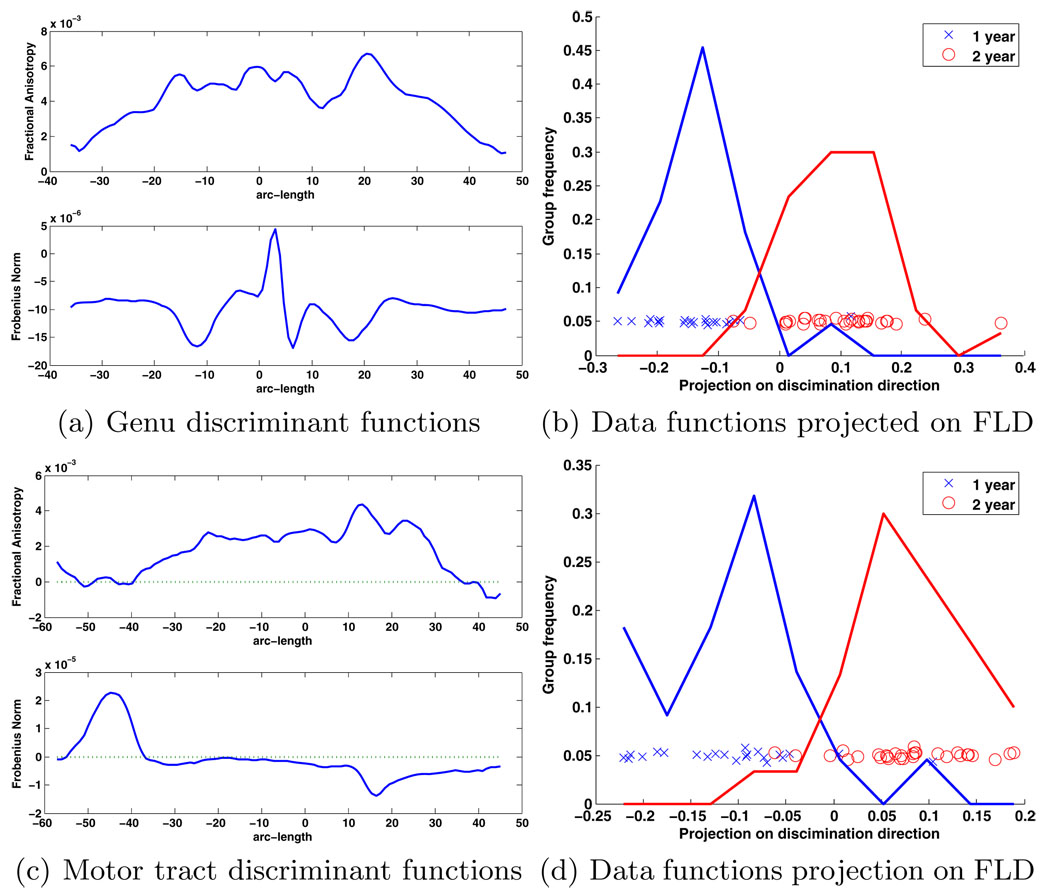
Fig. 4.
Linear discriminants from one to two years for the (a) genu and (c) left motor tracts expanded into original functional basis. These are the functions integrated with the original data that maximally separate the groups. In the genu tract the FA values increase from one to two years, and the Frobenius norm values decrease. For the motor tract, the results are similar for FA, but the norm increases at the base of the tract and decreases towards the top. The projection of the (b) genu and (d) motor tract curves onto the discrimination direction shows the strong separation between the groups.

