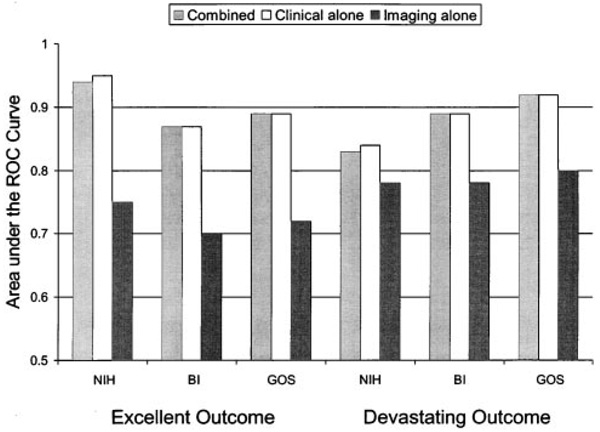
Figure 1.
Area under the receiver operating characteristic (ROC) curves for each of the models. Differences in model chi-squares were tested. For all 6 outcome measures, the combined model was not significantly better than the clinical alone model. For all 6 outcome measures, the combined model was significantly better (P<0.005) than the imaging alone model. NIH indicates National Institutes of Health stroke scale score; BI, Barthel Index score; GOS, Glasgow Outcome Scale score.

