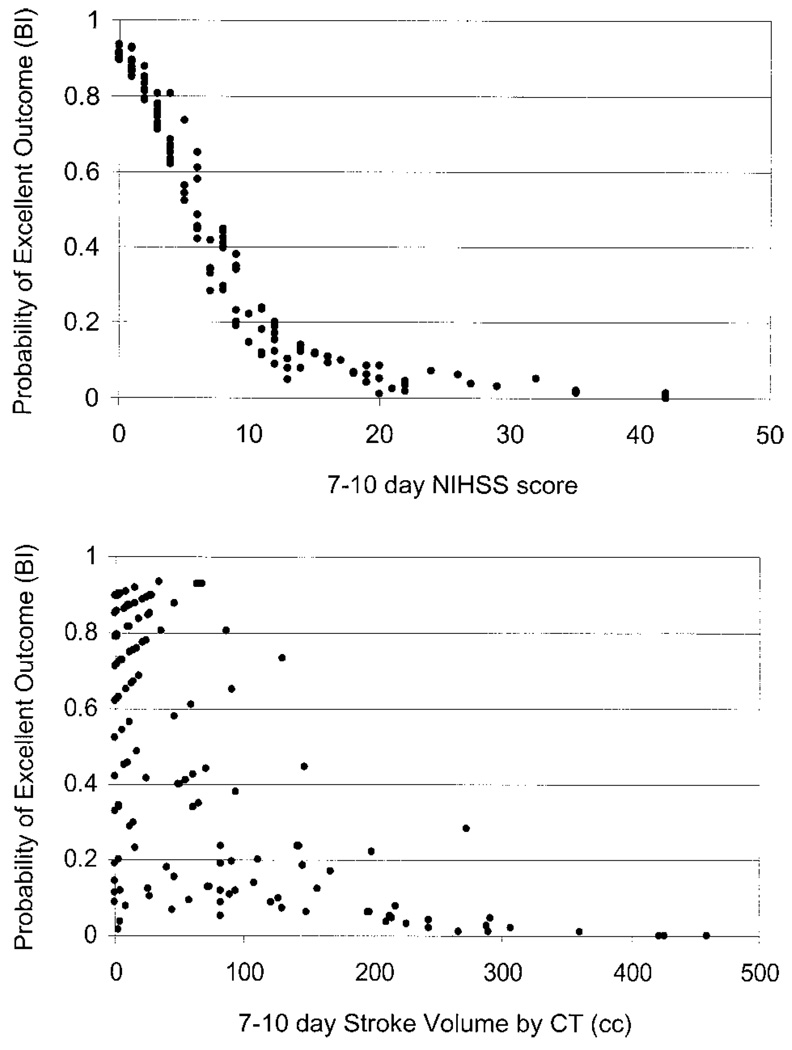
Figure 3.
Partial predictive power. Top, Role of NIHSS score measured at 1 week in predicting probability of outcome for the combined excellent outcome model as determined by Barthel Index. The narrow band of predicted probabilities suggests that the NIHSS is dominating the prediction. Bottom, Role of infarct volume measured at 1 week in predicting probability of outcome for the combined excellent outcome model as determined by the Barthel Index. The broad range of predicted probabilities suggests that the other variable (NIHSS) is controlling the prediction of outcome. NIHSS indicates National Institutes of Health Stroke Scale; BI, Barthel Index.

