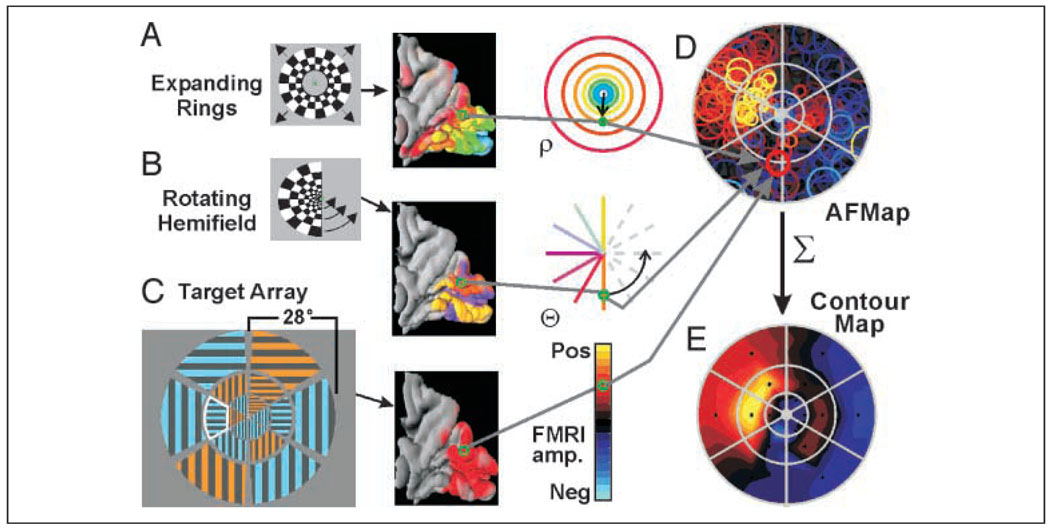
Figure 1.
Construction of AFMaps and ROImaps. A flickering checkered annulus (A) and a rotating hemifield (B) were used to determine the stimulus eccentricity (rho) and angular position (theta) that maximally activated each responsive voxel in the brain and to create color-coded maps displayed on a 3-D model (medial view, posterior to right) of the cortical surface within the occipital lobe and adjacent portions of the parietal cortex. Color codes for eccentricity and polar angle as indicated in the third column (for angular position, orange = lower vertical meridian [VM]; yellow = upper VM; purple = horizontal meridian). The preferred rho and theta position for each voxel were used to place circle symbols at corresponding positions on a chart of the visual field (gray arrows, D). Size of symbols provides a measure of experimental error in estimating retinotopic coordinates for each voxel. Color of symbols encodes amplitude of attention-related fMRI activation recorded during separate task in which subjects attended to a verbally cued target segment within a dartboard-like array of striped and colored segments. Here, the cued segment is indicated by a white outline that was not part of the actual stimulus. The pattern of circles for all active voxels shows distribution of attention-related activity, or attentional field map (AFMap), as it would appear within the observer’s field of view and relative to the target array (gray grid in D). (E) To compare attentional effects for different target segments, the fMRI amplitudes of all voxels representing each segment (circles whose centers were within a segment’s boundaries) were averaged and the resulting values were used to color code the center points of each segment (small black asterisks) on a second map with colors interpolated between data points by fitting with a smooth surface viewed here as a contour map (a.k.a. region-of-interest map ROImap).

