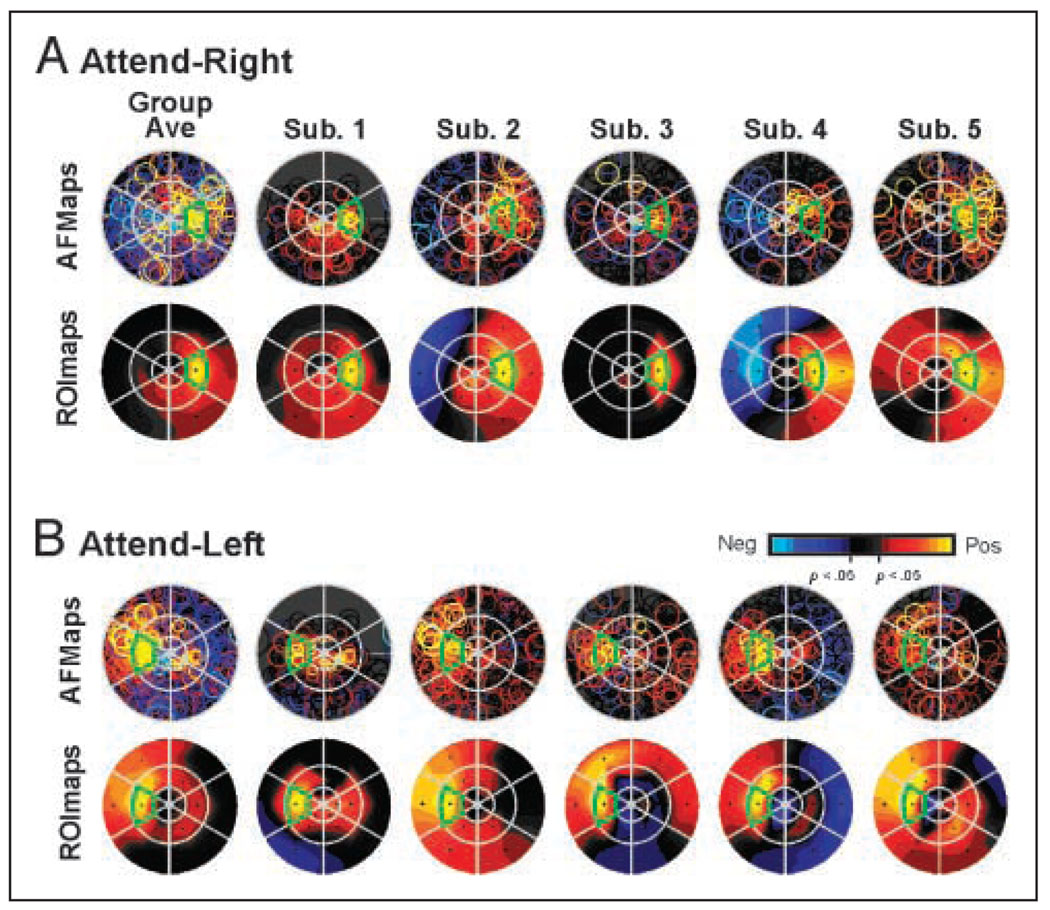
Figure 4.
AFMaps and ROImaps for the attend-right (A) and attend-left (B) conditions of Experiment 1. (See Figure 1 and text for details of flat map construction and interpretation.) “Group Ave” maps represent data pooled from five subjects whose individual maps are show to the right. Note color code for amplitude of fMRI modulation with statistically significant values (p < .05) indicated in yellow/red (positive, activating responses) or blue (negative, suppressive responses). Responses that were not significantly different from passive fixation baseline indicated in shades of gray/black.

