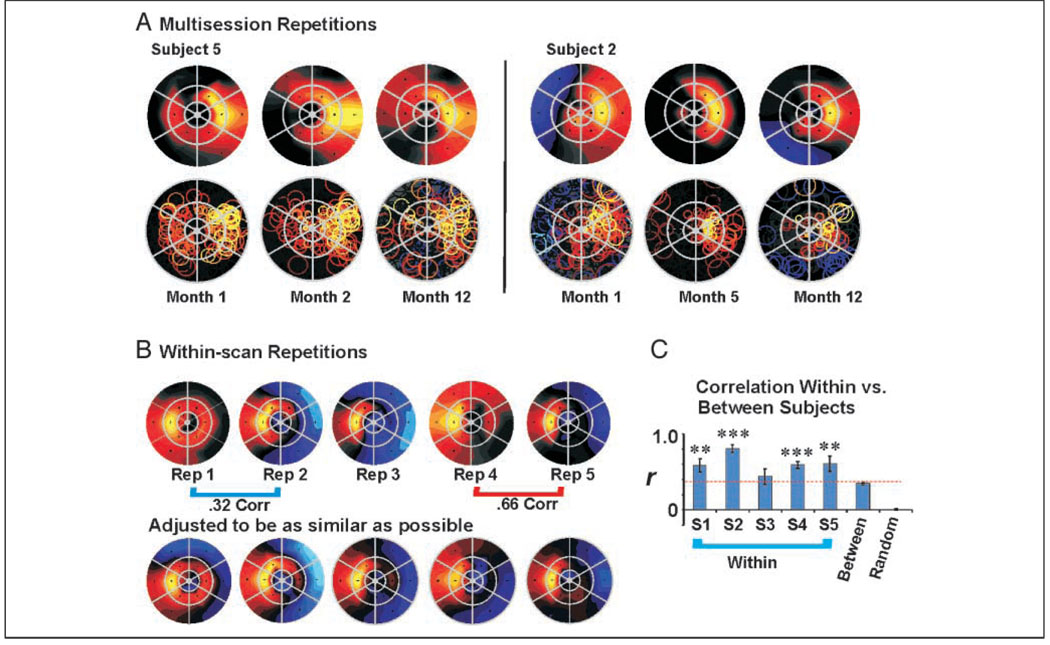
Figure 5.
Consistency of attentional topography. (A) AFMaps for two subjects showing the attend-right condition measured thrice over a 1-year period. Attended target location was middle right segment. Color scale as in Figure 4. (B) Five repeated scans for attend-left condition collected within a single session for one subject (#4 of Figure 4). Maps in B, bottom row maps have colors manually scaled to make topographic similarities more apparent, although gray/black colors may no longer indicate nonsignificant responses (see text). (C) Spatial cross correlation of attentional maps for same (within) or different (between) subjects. S1–S5 = within-subject correlations. Between = between subject correlations. Random = correlations for scrambled data (see text). Correlations within each subject were significantly higher than correlations between subjects (indicated by dotted red line). Correlations of the randomized data were not significantly different from zero. Asterisks indicate significance of individual-subject correlations compared with between-subject correlation in a two-tailed t test of Fisher transformed values, **<.01, ***<.005. Although the attentional conditions were the same in all cases, the data were obtained in the context of different experiments.

