Figure 7.
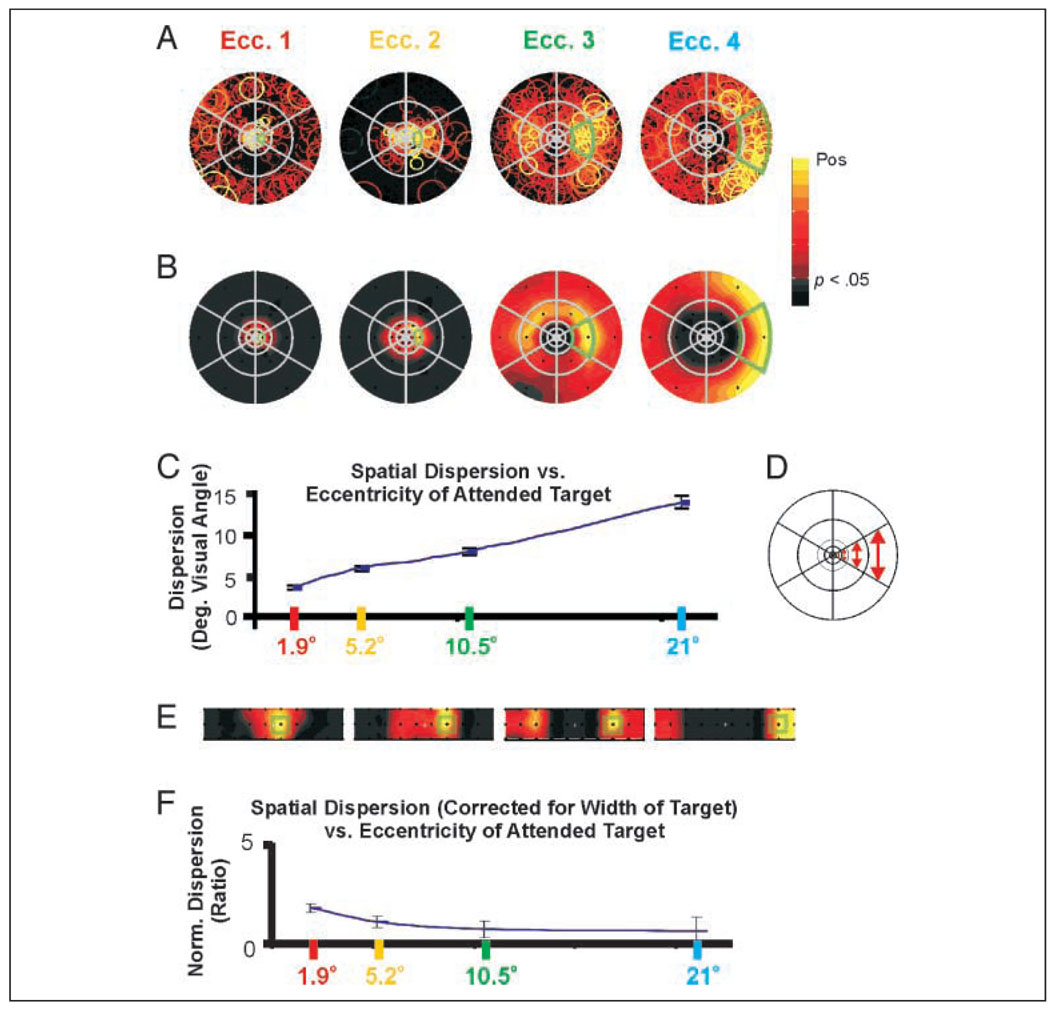
“Window of attention” increases with eccentricity in visual field but is constant in the cortex: Average (5 subjects) (A) AFMaps and (B) ROImaps for attended targets at four different eccentricities in the visual field. Note that due to large numbers of voxels per region, segments showing active voxels in the AFMaps do not necessarily have a high mean value for the ROImap. (C) Mean dispersion (in degrees of visual angle) versus mean target eccentricity for top 250 voxels having the strongest attention-related signals. (D) Schematic of stimulus array illustrating increase in target size with eccentricity. (E) ROImaps of B spatially transformed to equate for sizes of targets. In all maps, green outlines indicate the relative size and position of the cued target. This transformation roughly compensates for cortical magnification (see text) and provides an approximation of the relative dispersion of attentional effects within the cortex (V1). (F) Mean dispersion normalized as in E versus target eccentricity. Normalized dispersion is nearly constant with eccentricity, suggesting that size of the attentional “window” in cortical space may be constant. Note: The color scale in these maps excludes negative values because the temporal phase mapping delay design does not permit independent visualization of suppressive effects.

