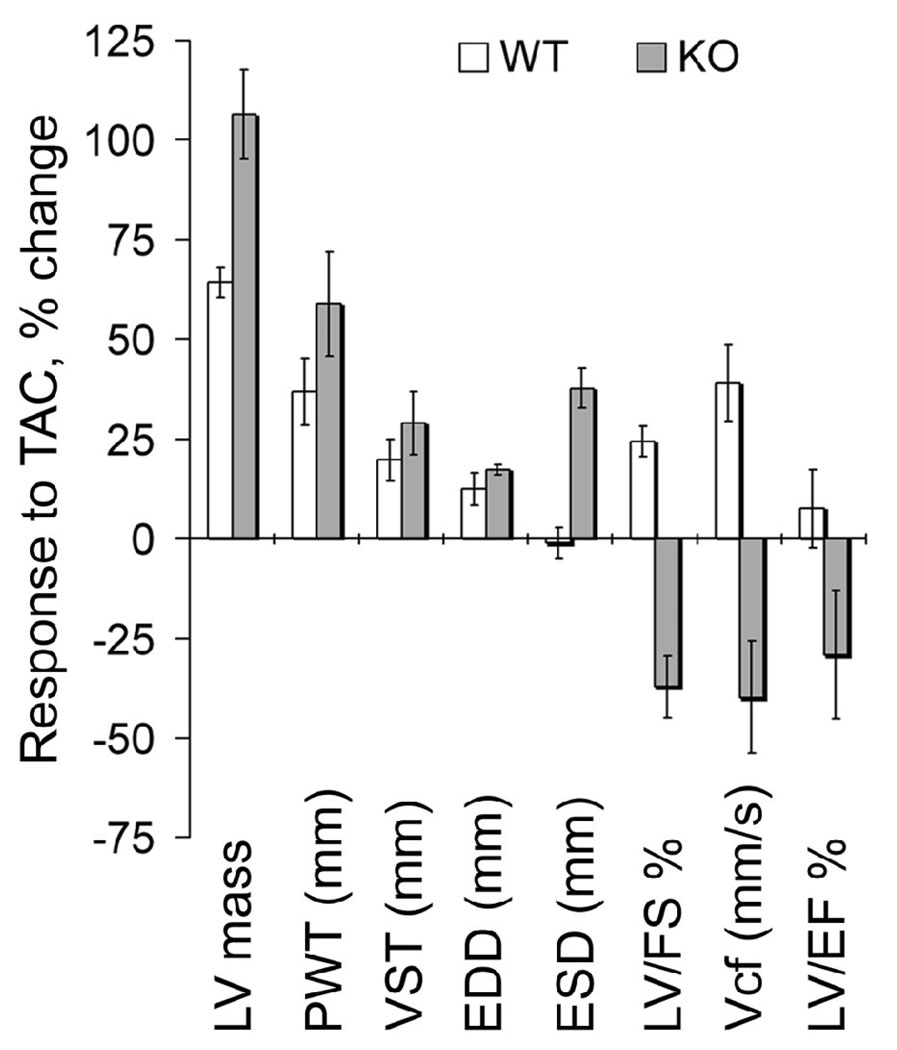
Figure 3.
Differential response of WT and knockout hearts to TAC. The graph depicts the response to TAC procedure and is based on data from Table 2. The values plotted are the % change in WT and KO hearts following TAC. The pre-TAC values for WT and KO were considered 100%. Error bars denote SE of the mean.

