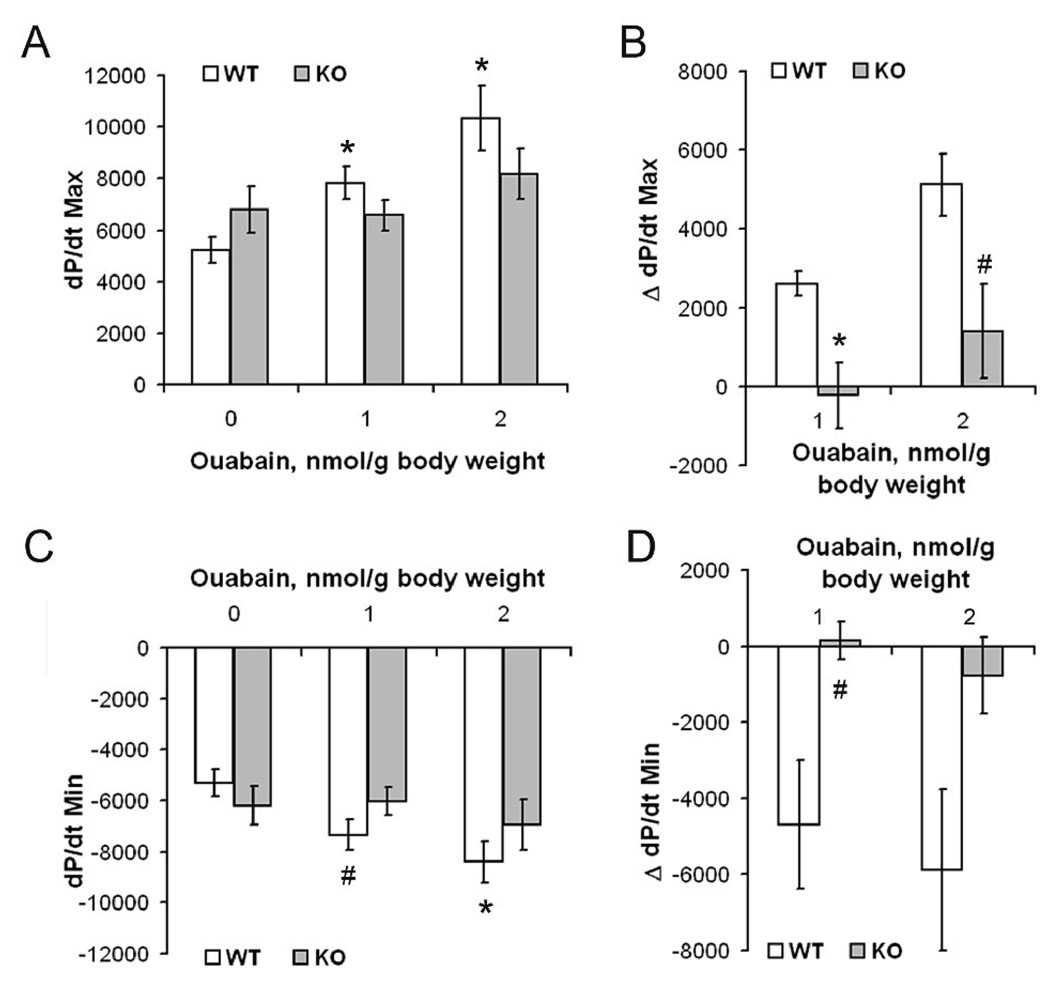
Figure 4.
Effect of ouabain on cardiac contractility in WT and knockout mice. The effect of 0, 1 or 2 nmol/g body weight ouabain on the maximum rate of contraction dP/dtMax (A), and the maximum rate of relaxation dP/dtMin (C) was determined in WT and KO mice (n=6 each). Values are represented as Mean ± SE. * p < 0.01, # p < 0.05 versus WT baseline (0 nmol/g body weight of ouabain). The differences in pressure values compared to the baseline were plotted as ΔdP/dtMax (B) and ΔdP/dtMin (D). Values are represented as Mean ± SE. * p < 0.01, # p < 0.05 between WT and KO.

