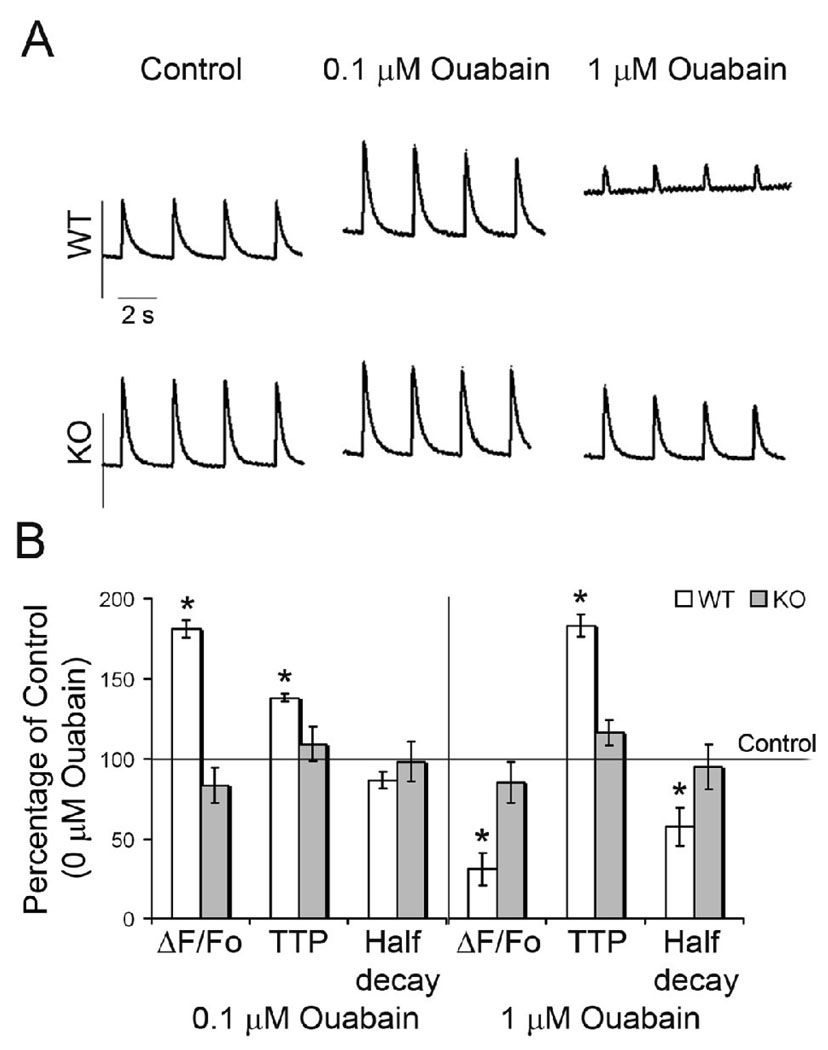
Figure 5.
Analysis of Ca2+ transients in isolated WT and knockout cardiomyocytes. Cardiomyocytes were paced at 0.5 Hz in the presence or absence of ouabain. (A) Representative plots of Ca2+ transients are shown. Ouabain had no effect on Ca2+ transients in KO myocytes. (B) Summary of the effects of ouabain on the kinetics of intracellular Ca2+ transient. Data are represented as Mean ± SE and expressed as a percentage of the respective pre-ouabain values. n=10 for WT, n=7 for KO. * p < 0.01, ΔF/Fo corresponds to the change in the amplitude of the Ca2+ transient normalized to the resting fluorescence, TTP indicates time to peak, Half decay is the time to 50% relaxation.

