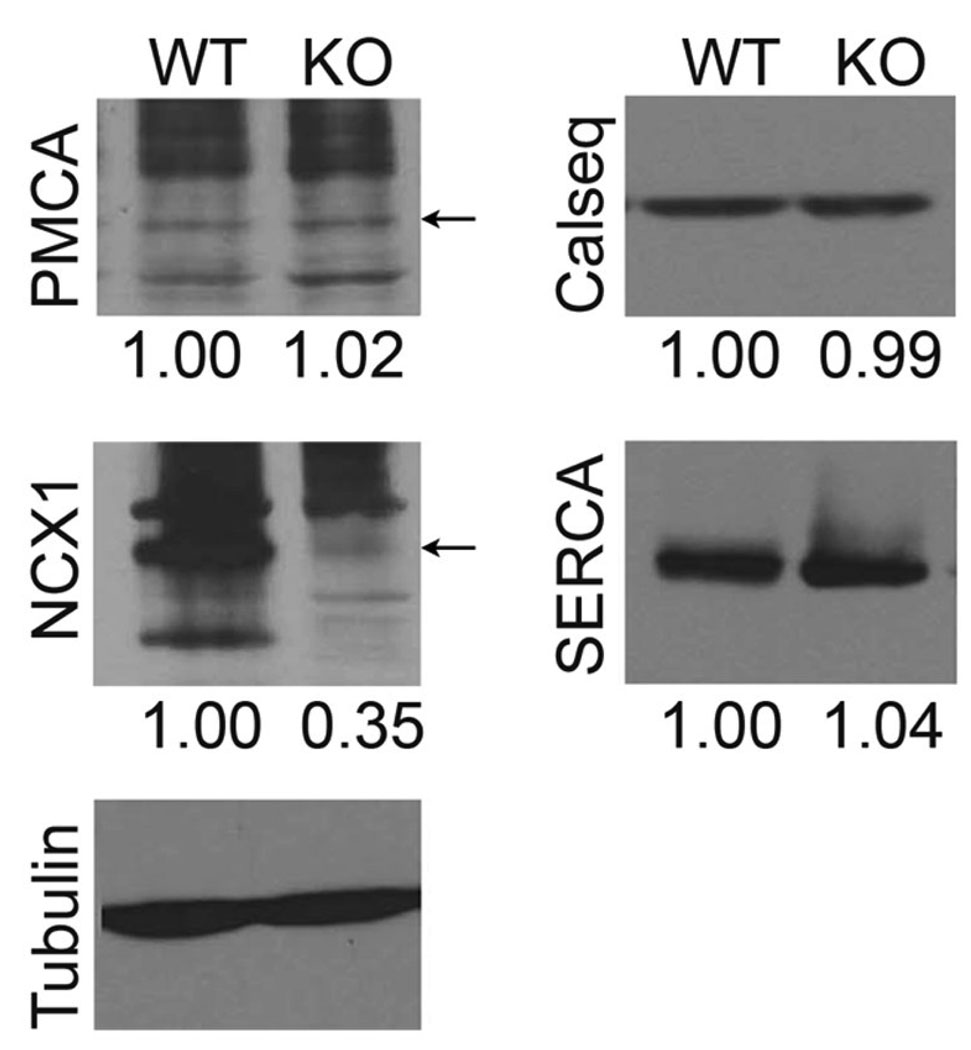
Figure 6.
Immunoblot analysis of the levels of Ca2+-handling proteins from Na,K-β1 KO and WT hearts. Representative blots from three independent experiments are shown. The numbers below each panel represent the ratio of band intensities between the specific protein and the loading control tubulin normalized to the WT. For PMCA and NCX1, the major bands are pointed by arrows. Multiple bands representing either aggregation or degradation products have been reported for both PMCA and NCX1.

