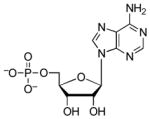
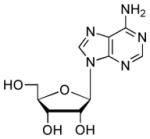
Table 1.
Ligand dissociation constants for substrate-fragments with APS reductase.
| Ligand | Structure | Kd [μM][c] | ΔΔG [kcal/mol][d] | pKa |
|---|---|---|---|---|
| APS[a] |  |
0.20 | N/A | ~2 (O)[e] |
| AMP |  |
5.4 | 2.0 | 6.8 (O)52 |
| 5′-Phosphoribose |  |
93 | 5.1 | ~6.8 (O)[f] |
| Adenosine |  |
3000 | 5.8 | 3.6 (N1), 12.4 (O)54 |
| Phosphate |  |
66000 | 7.7 | 1.97 (O), 6.82 (O), 12.5 (O)55 |
| Ribose |  |
680000 | 9.1 | 12.22 (O)56 |
| Adenine[b] |  |
≥90000 | ≥7.3 | 4.15 (N1), 9.80 (N9)56 |
| Sulfate[b] |  |
≥310000 | ≥8.6 | −3 (O), 1.89 (O)57 |
The Kd of APS was measured under single turnover conditions, in the absence of thioredoxin, as described in the methods section.
Due to the limits of solubility or solution ideality the reported values are lower limits.
For substrate-fragments in this table values of Ki were determined under single turnover conditions from the dependence of the observed rate constant at a given inhibitor concentration under conditions of subsaturating APS, such that Ki is equal to the Kd. Each value reflects the average of at least two independent experiments, and the standard deviation was less than 15% of the value of the mean. Kinetic data were nonlinear-least squares fit to a model of competitive inhibition.
Energetic difference in affinity of APS relative to inhibitor, ΔΔG = −RTln(KdAPS/KdFragment).
pKa estimated from value measured for 2′-deoxy-5′-phosphoribose58.
pKa estimated from value measured for 3′-phospho-5′-adenosinephosphosulfate59.
