Fig. 3.

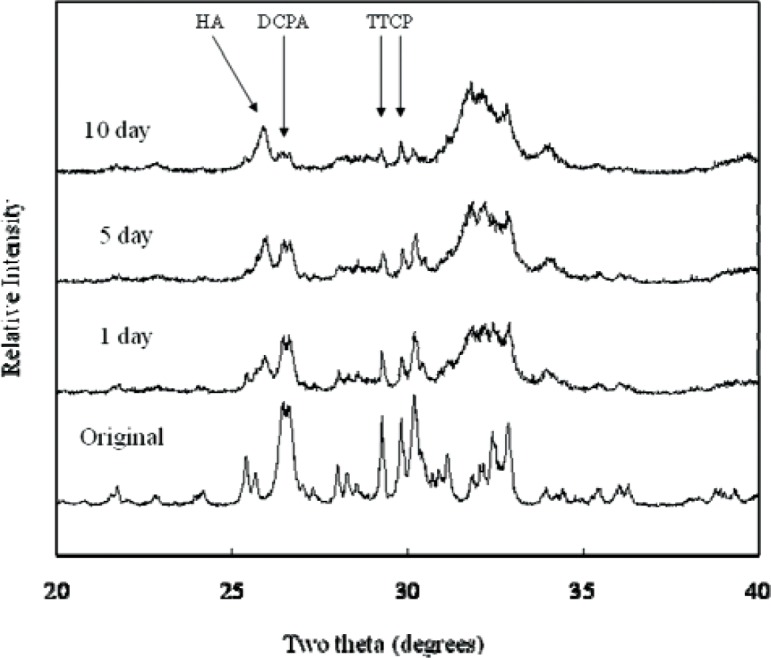
Powder x-ray diffraction patterns of CPC specimens with TTCP/DCPA (1/3) after immersion in the PLS for 1 d, 5 d, and 10 d. The peaks used for the calculation of the HA formation are marked.

Powder x-ray diffraction patterns of CPC specimens with TTCP/DCPA (1/3) after immersion in the PLS for 1 d, 5 d, and 10 d. The peaks used for the calculation of the HA formation are marked.