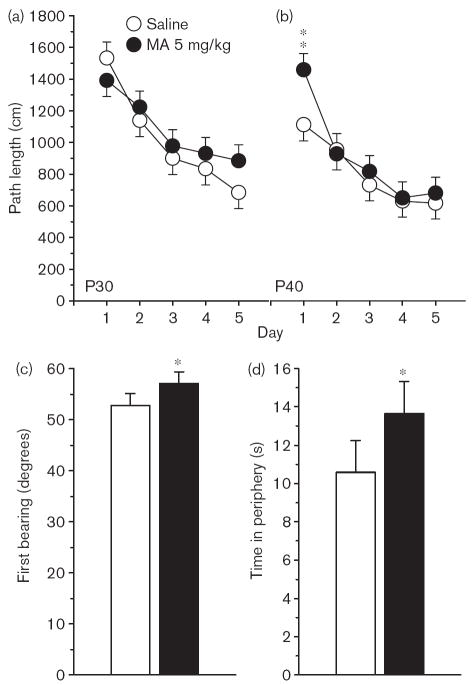
Fig. 6.
Experiment 1. (P30, P40) Morris water maze, phase 3: Phase 3 was with the platform position being moved to a different quadrant from that during acquisition or reversal and with a smaller (5 × 5 cm) platform. (a) Path lengths averaged across 4 trials/day and across sexes for the P30 groups. (b) Path lengths as in (a) but for the P40 age groups. (c) First bearing averaged across trials, days, sexes, and ages to show the main effect of Group. (d) Time in the periphery (s) averaged across trials, days, sexes, and ages to show the main effect of Group. Data are means ± SEM. Rats received 5 mg/kg methamphetamine (MA) four times a day on P11–20. *P<0.05 **P<0.01 vs. saline.

