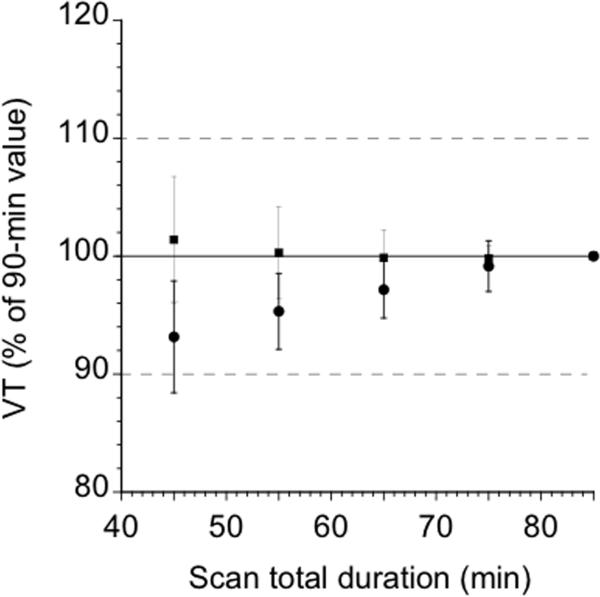
Figure 3.
Time stability of [11C]NPA VT in the striatum (squares) and cerebellum (circles). Times refer to the midpoint of each 10-min acquisition. Data of shorter duration were analyzed, and estimated VT (mean ± SD) is expressed as a percentage of the value derived with the complete data set (90 min). Each point is the average of 12 scans. Deviation from 100% of mean value indicates bias associated with shorter scanning times, whereas SD indicates error associated with shorter scanning times.

