
Figure 2.
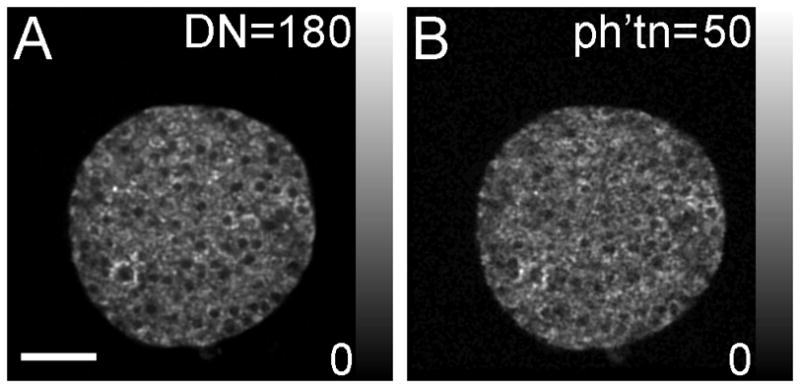
Gray scale images of islet NAD(P)H detected using A) the conventional non-descanned detector and B) the single-photon counting detector. The NAD(P)H distribution within the islet can be resolved using both forms of detection, yielding approximately equivalent image quality. Scale bar in A represents 50μm. Note, color scale in A is to an 8-bit digitized number (DN, scaled between 0 and 180), whereas in B it is to the number of photons collected (ph’tn, scaled between 0 and 50).