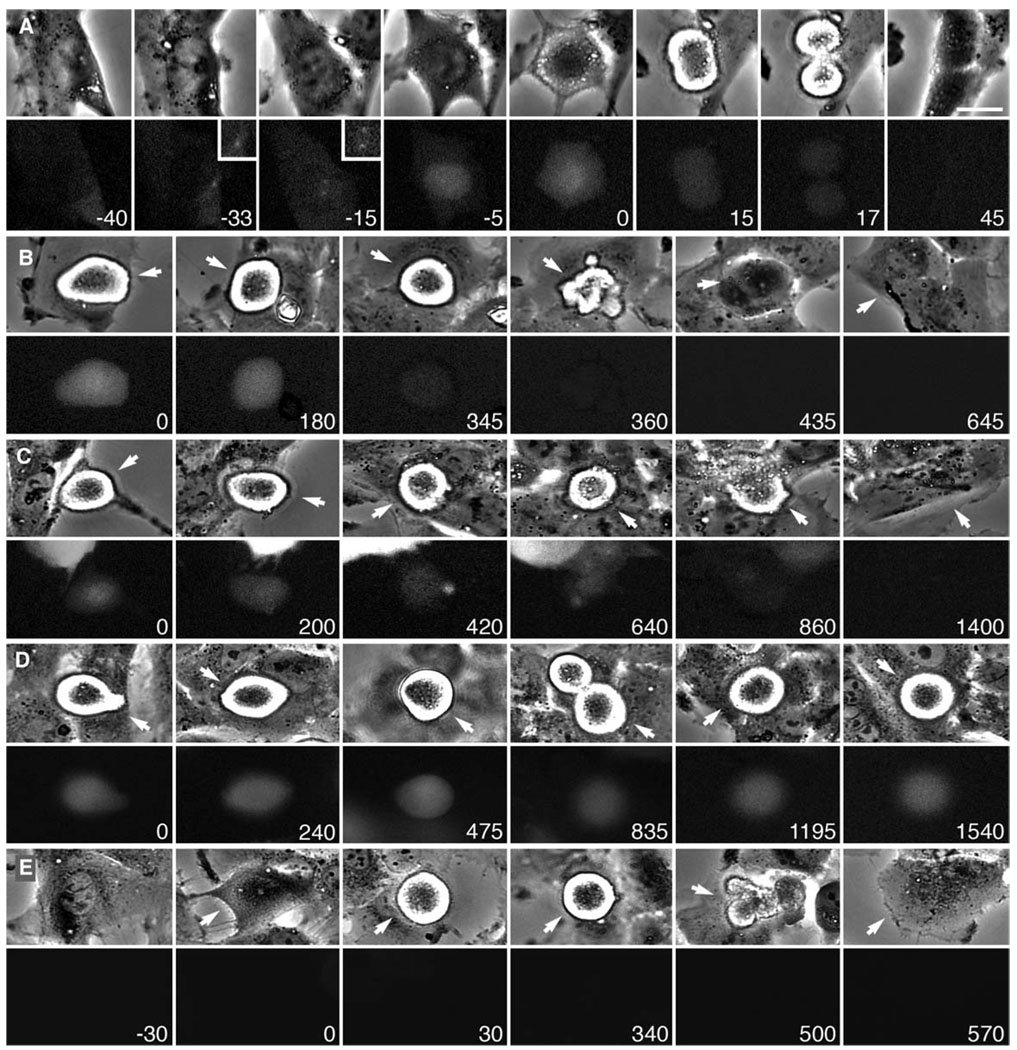
Figure 2. Cyclin B Degradation Is Required for RPE1 Cells to Exit Mitosis in the Presence of an Unsatisfied SAC.
Selected phase-contrast (top) and fluorescence (bottom) frames from time-lapse video recordings.
(A–C) RPE1 cells were transfected with a cyclin B-GFP plasmid and GFP-expressing cells were followed.
(A) Non-drug-treated control cell in which cyclin B-GFP accumulates in the nucleus during prophase (−5 min) and is then destroyed after the SAC is satisfied and the cell enters anaphase (15–17 min). Insets show centrosomes at a higher magnification. Time, relative to nuclear envelope breakdown, is shown in minutes. Scale bar equals 5 µm.
(B and C) GFP-expressing mitotic cells in the presence of 200 nM (B) or 3.2 µM (C) nocodazole. The arrow in each frame marks the cell of interest. Time is shown in minutes. Note that the cyclin B-GFP fluorescence begins to visibly decline throughout the block and is barely detectable near the time the cells finally begin to exit mitosis (360 min in [B] and 860 min in [C]).
(D and E) RPE1 cultures were transfected with a GFP-cyclin B-Δ85 plasmid. 24 hr after transfection, the cultures were incubated with 200 nM nocodazole and areas were subsequently followed by dual-mode time-lapse microscopy. In the same field of view, we could find GFP-expressing and nonexpressing cells.
(D) GFP-expressing cells (e.g., arrow) remained in mitosis until filming was terminated after more than 24 hr, and throughout this time the GFP fluorescence remained relatively level (see Figure 3).
(E) In contrast, cells in the same culture that were not transfected with the plasmid (e.g., arrows) escaped mitosis after ~8 hr. See also Figure 3.

