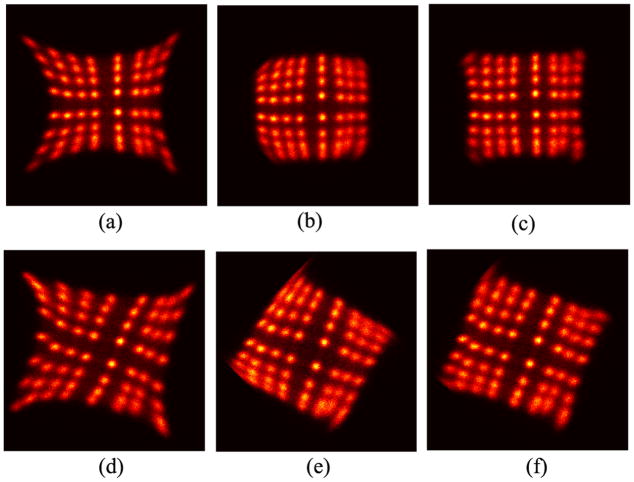
Fig. 2.
Flood histograms after correction for effects of curved optical fibers; (a), (b) and (c) are for the PET detector when placed outside the 7T magnetic field, and (d), (e) and (f) are when the detector is placed in the magnetic field. (a) and (d) use Anger’s equations, (b) and (e) use Zhang’s method, and (c) and (e) use the proposed adaptive formulae with α = 0.7 and θ = 0°. All formulae are listed in in Table I

