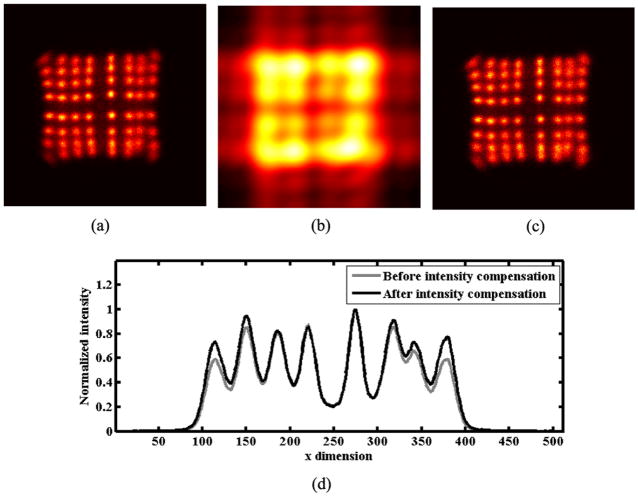
Fig. 3.
Intensity compensation; (a) the flood histogram from Fig. 2(c) for comparison, (b) the smoothed image |k(x, y)|, (c) the intensity compensated image p(x, y), and (d) normalized intensity profiles obtained by summing (a) and (c) along the y dimension.

