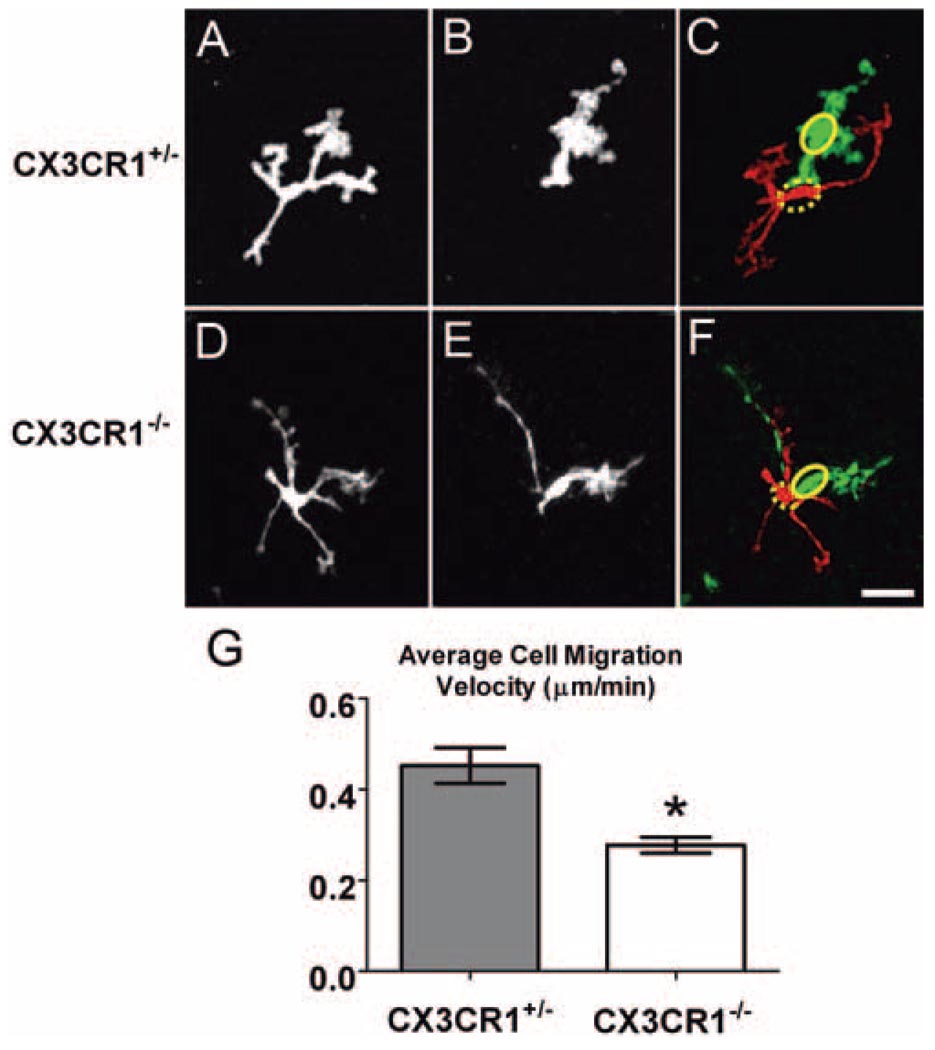
Figure 5.
CX3CR1+/− and CX3CR1−/− retinal microglia exhibited migratory behavior after focal laser injury. Representative examples of CX3CR1+/− and CX3CR1−/− retinal microglia at t = 0 (A, D) and at t = 495 seconds (B, E). Subtraction images (C, F) show the initial (red, with soma position indicated by dashed ellipse) and final (green, with soma position indicated by solid ellipse) positions of migrating microglia. Scale bar, 25 µm. (G) The average soma migration rate in CX3CR1+/− microglia (n = 150 cells in 11 recordings) was significantly higher than in CX3CR1−/− microglia (n = 157 cells in 12 recordings). *P < 0.05.

