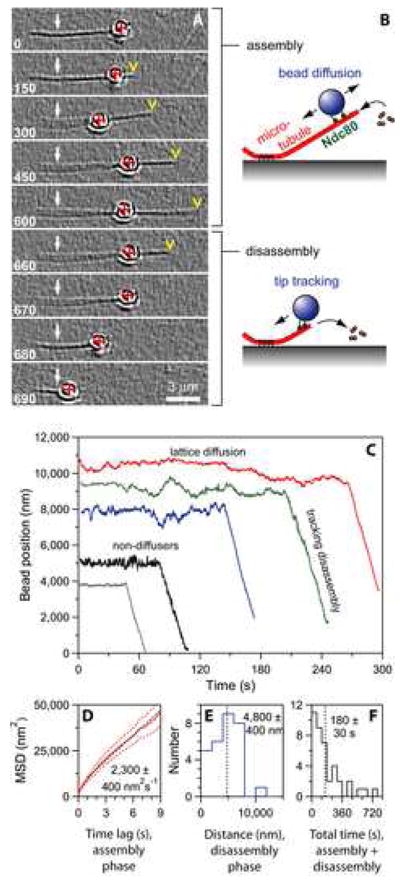
Figure 1. The Ndc80 complex couples cargo to dynamic microtubules.

(A) An Ndc80-coated bead diffuses back-and-forth over the microtubule lattice and fails to track with the tip during filament growth (0 – 600 s). During filament shortening, it tracks with the disassembling tip (600 – 690 s). Selected frames from Movie S1 are shown. White arrows indicate the coverslip-anchored portion of the microtubule seed, red crosses indicate the bead center, and yellow arrowheads indicate the microtubule tip. Elapsed times are in seconds.
(B) Schematic diagram of the Ndc80 bead motility assay. In the absence of tension, Ndc80-based linkages usually exhibit lattice diffusion as the filament grows by addition of tubulin subunits to the tip, and they remain tip-bound even as subunits are rapidly lost from the tip during shortening.
(C) Records of bead position versus time, measured without applied force. Increasing position represents movement away from the anchored portion of the microtubule. For clarity, the records are offset vertically by an arbitrary amount.
(D) Mean squared displacement plotted against time for the subset of beads that underwent lattice diffusion. Data are mean (solid red curve) ± s.e.m. (dotted red curves), computed from N = 26 records. Black line shows linear fit used to determine diffusion coefficient.
(E and F) Histograms of bead displacement during microtubule shortening (N = 29 records) and total duration (including growth and shortening phases) of microtubule attachment (N = 40) for a population of beads. Dotted vertical lines indicate mean values. The data in (D – F) are pooled from experiments using beads prepared with 0.6 to 15 nM Ndc80 complex, corresponding to molar ratios of 110 to 2,700 complexes per bead.
