
Figure 5. Binding of individual Ndc80 complexes to microtubules is sensitive to ionic strength.
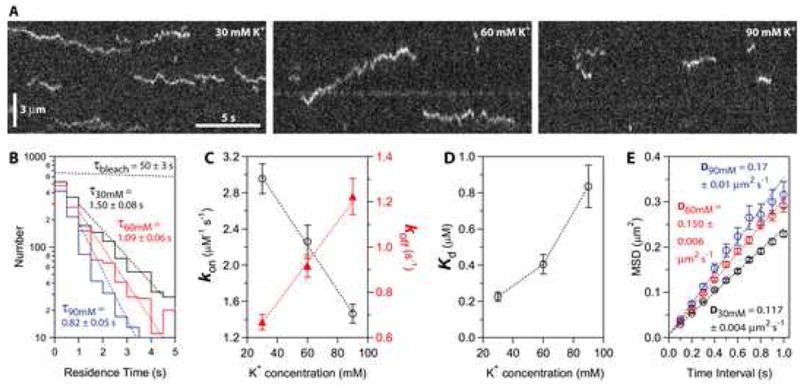
(A) Kymographs showing binding and diffusion of Ndc80-GFP on taxol-stabilized microtubules in buffers with varying ionic strength (30, 60 and 90 mM K+). Position along the microtubule is depicted on the vertical axis while time changes along the horizontal axis. Long-duration events (> 3 s) were more common at lower ionic strength. Concentration of Ndc80 complex, 20 pM.
(B) Residence time distributions for Ndc80 complexes in 30 mM K+ (black histogram, N = 1,729 binding events on 61 microtubules in 12 recordings totaling 40 min), 60 mM K+ (red histogram, N = 1,333 events, 57 microtubules, 11 movies, totaling 37 min) and 90 mM K+ (blue histogram, N = 877 events, 54 microtubules, 11 movies, totaling 37 min). Dotted lines show weighted exponential fits used to determine mean residence times. The exponential distribution of bleach times for single GFP molecules in control experiments is depicted by the uppermost dotted black line, corresponding to a mean bleach time of τbleach = 50 ± 3 s.
(C and D) Raising the ionic strength lowered the association rate, kon (left axis in C, open black circles), and increased the dissociation rate, koff (right axis in C, filled red triangles). As a result, the apparent equilibrium dissociation constant, Kd = koff·kon−1, increased 4-fold (D). On-rates were calculated as the number of observed binding events per tubulin dimer per second, divided by the Ndc80 concentration. Off-rates were taken from τ−1 in (B). Uncertainties represent s.e.m.
(E) Raising the ionic strength speeds lattice diffusion of Ndc80 complexes. Mean squared displacement (MSD) is plotted against time for each ionic strength. Dotted lines show linear fits used to determine diffusion coefficients. Data are mean ± s.e.m., computed from N = 2,002 events for 30 mM K+, N = 1,302 events for 60 mM K+, and N = 664 events for 90 mM K+.