
FIG. 3.
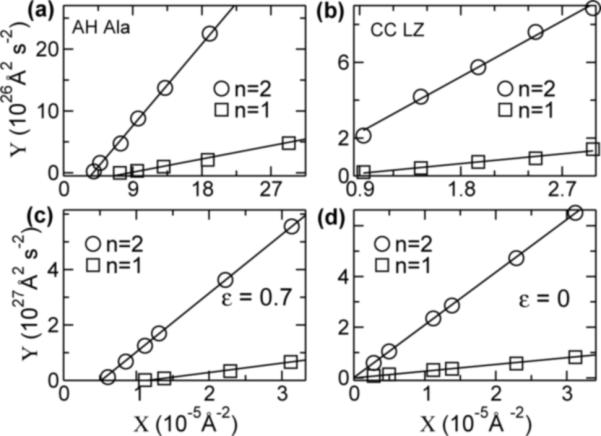
X − Y plot (X ≡ L−2, ). Solid line: linear fit. The initial rise phase in Fig. 1 was not used in the fit. Only portions near the origin are shown. In (d), lines converge to the origin, hence fc ≈ 0.
Official websites use .gov
A
.gov website belongs to an official
government organization in the United States.
Secure .gov websites use HTTPS
A lock (
) or https:// means you've safely
connected to the .gov website. Share sensitive
information only on official, secure websites.
X − Y plot (X ≡ L−2, ). Solid line: linear fit. The initial rise phase in Fig. 1 was not used in the fit. Only portions near the origin are shown. In (d), lines converge to the origin, hence fc ≈ 0.