
FIG 4.
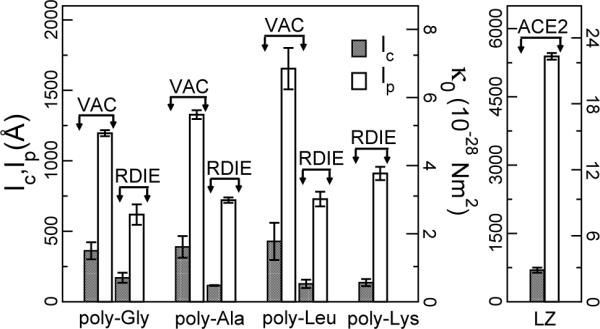
lc, lp, and κ0 of AH and LZ determined from the X − Y plots for n = 1 (Fig. 3). For LZ, labels of the y-axes follow those of AH on respective sides.
Official websites use .gov
A
.gov website belongs to an official
government organization in the United States.
Secure .gov websites use HTTPS
A lock (
) or https:// means you've safely
connected to the .gov website. Share sensitive
information only on official, secure websites.
lc, lp, and κ0 of AH and LZ determined from the X − Y plots for n = 1 (Fig. 3). For LZ, labels of the y-axes follow those of AH on respective sides.