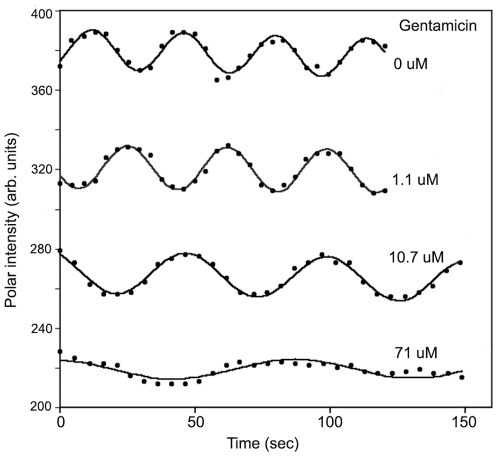
Figure 2. Effect of cations on the MinD oscillation periods of one single E. coli PB103 cell.
Dots represent experimental polar intensity while solid lines are least square fits to the intensity data. Sequential gentamicin concentrations of 1.1 µM, 11 µM and 71 µM changed the period of this cell from 32 s (no gentamicin) to 37 s, 52.5 s, and 89 s respectively. At high cation concentrations the amplitude of the oscillations decreased and so periods above 200 s could not be measured reliably. The curves for gentamicin concentrations below 71 µM have been offset upwards for clarity: all curves have approximately the same background (non-oscillating) intensity.

