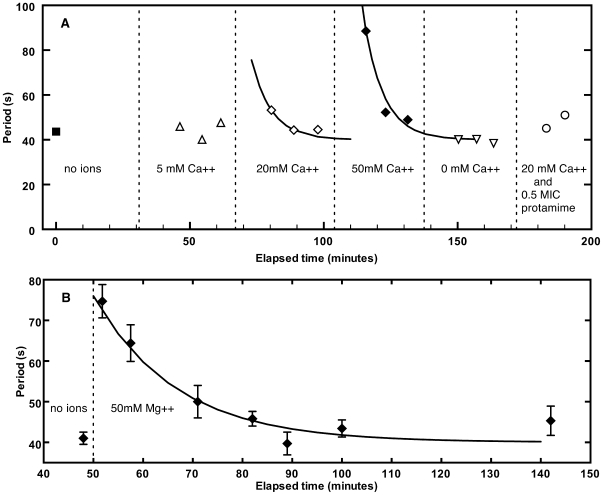
Figure 7. Time response of oscillation periods to changes in Ca++ concentrations.
(A) Time response of the oscillation periods to Ca++ ion concentration changes in 10 mM HEPES buffer at pH = 7.0. The intervals when the ion concentration was constant are indicated. At the beginning of such an interval the ion concentration was increased to the stated value and the first fluorescence measurements were made at this new concentration after a 10 minute delay. Each data point represents the average period of all bacteria in the field of view whose period could be determined. Different data points represent different areas of the sample chamber and hence different groups of bacteria. The two solid lines represent fits of exponential decays to the 20 mM and 50 mM data points. The period decay time for both curves is 7.5 min. The last two points marked by open circles show the periods of two bacterial groups after the chamber was refilled with 20 mM Ca++ ions and 0.5 MIC protamine. Effective screening of protamine by Ca++ is evident. (B) Example of period changes when E. coli bacteria were exposed to 50 mM Mg++ in 10 mM HEPES buffer at pH = 5.5. Different data points represent different bacterial groups. Mg++ ions were added at the time of the arrow and an improvement of the sample chamber allowed period measurements before the usual 10 minute delay. Solid curve is a fit of an exponential function with a time constant of 16.6 min.

