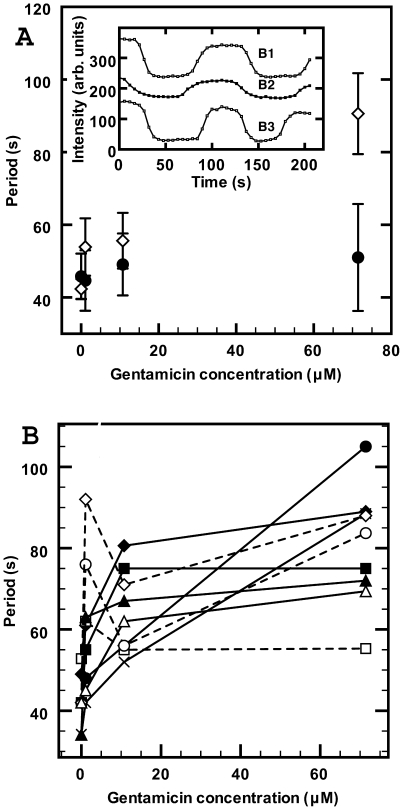
Figure 8. Variation of MinD oscillation period with gentamicin.
(A) In 10 mM HEPES buffer at pH of 7.0, the period increases with gentamicin concentration (open diamonds). As shown in the inset, for three bacteria labeled B1, B2 and B3, for gentamicin concentrations of 70 µM or higher the wave form of polar intensity oscillations often became more like square-waves, where the intensity at the poles remained stationary for longer time periods. In the presence of 10 mM HEPES buffer and 20 mM Ca++ the oscillation period increase (filled circles) is that expected for 20 mM Ca++ alone and periods were independent of the gentamicin concentration within our measurement error. (B) Oscillation periods as function of gentamicin concentration (no added Ca++) for nine bacteria at a pH of 7.0. The period increases rapidly at low concentrations for all bacteria. Changes in the period on further increase in the gentamicin concentration varied widely in both sign and magnitude. The general trend was for the period to increase with increasing concentration, but some bacteria exhibited occasional decreases (dotted lines). Lines are an aid to the eye for each bacterium.

