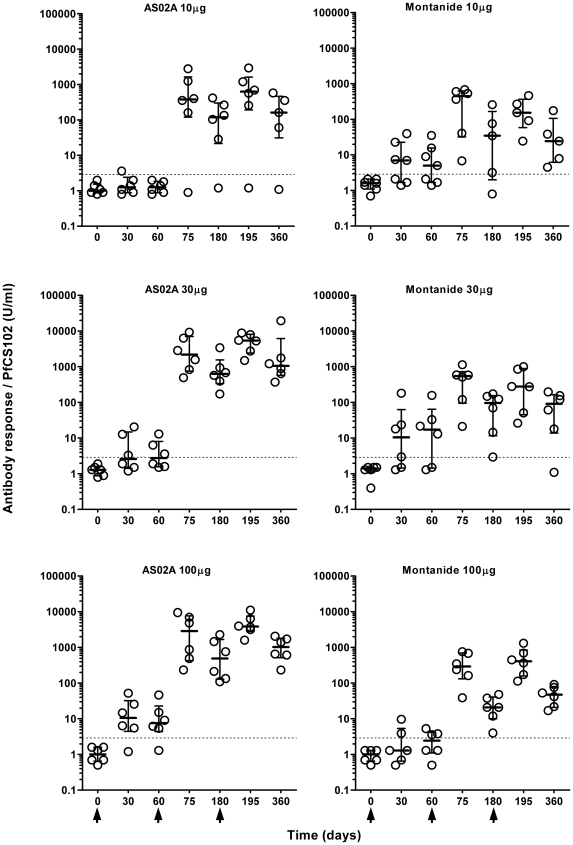
Figure 2. Time course of anti-PfCS102 antibody response upon PfCS102 immunization.
Anti-PfCS102 antibodies were measured in plasma samples by ELISA. Results are expressed as individual data in U/ml for each immunization group, with quartiles. Arrows indicate the times of vaccination.

