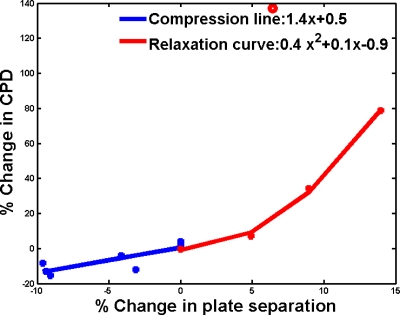
Figure 10.
Percentage change in detected vascularity (CPD) given as a function of percentage change (x) in breast compression or plate separation for eight patients. Doppler measurements were performed after subject had been under compression for the approximately 10 min duration of other scans. Additional compression beyond that for the pulsatility resulted in a drop in blood flow, giving a linear fit to CPD change: 1.4x+1.5. Relaxations below 15% resulted in a sudden increase in CPD, which may suggest that measurements should be acquired after a brief relaxation period to avoid the non-steady-state rush of blood from the measured region. Ignoring the obvious outlier (open circle), CPD changed in a nonlinear manner (refer to text).

