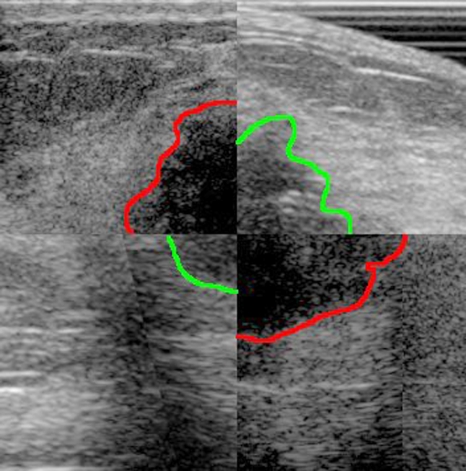
Figure 2.
Checkerboard (2×2) pattern of a registered pair of a prechemotherapy image (top left and bottom right squares) and a postchemotherapy image (top right and bottom left squares). The hypoechoic boundaries are drawn for convenience [dark gray (red in online figure) for pre-chemotherapy and medium gray (green in online figure) for postchemotherapy images]. The mean registration error was 8.4±2.6 mm. It can be seen from spatial alignment of these images by registration that the tumor had shrunk in size with therapy. Other reasons could include changes due to differences in compression forces and thickness, as well as differences in positioning within the range of normal mammographic repositioning.

