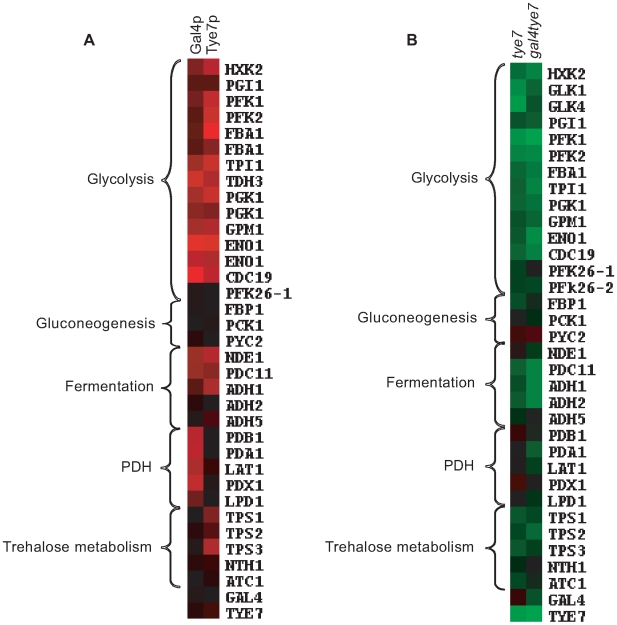
Figure 4. Gal4p and Tye7p bind to and regulate the expression of genes involved in the fermentation pathway under glucose growth conditions.
Heat map displays of the ChIP-CHIP and expression profiles were created with the Cluster and TreeView programs (http://rana.lbl.gov/EisenSoftware.htm). (A) Tye7p and Gal4p ChIP-CHIP binding profiles of selected metabolic targets with the single spot full-genome microarray. Fold enrichments displayed represent the intergenic probe for the respective gene and enrichments <1.0 were adjusted to 1.0 for graphical purposes. Black represents no binding while red represents binding with the color brightness indicating the degree of enrichment. Binding to the glycolytic genes was so strong that binding to two neighboring probes was sometimes observed. In such cases, both values were included as these occurred in situations where a shared promoter region contained two probes but the tiling array confirmed the presence of a single binding site. The fold enrichments of these and other metabolic targets are given in Table S6. (B) Transcription profile of selected metabolic genes for the tye7 and gal4tye7 strains. Black represents no change in expression, green is down-regulated, and red is up-regulated with the color brightness indicating the degree of expression change. The expression levels of these and other metabolic genes are given in Table S7.

